Graphical User Interface
UMR now comes with a GUI component that can be initialized with the –gui command:
$ umr --gui
The landing page describes by default the 0th ASIC found with a variety of parameters and features.
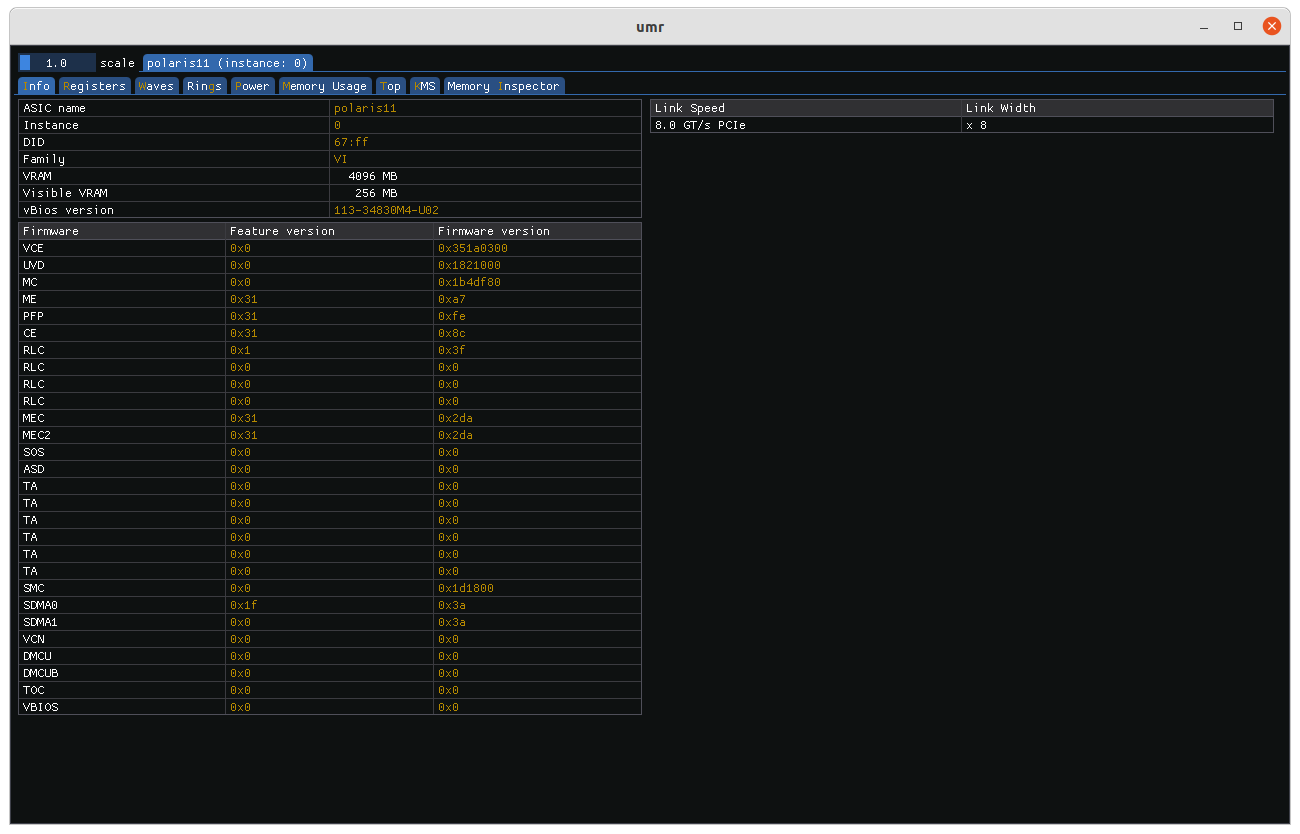
The topmost tab is where all of the detected ASICs are displayed. Below the ASIC tabs are the workpage tabs. The default tab that opens is the info tab which display information about the ASIC such as firmware version, ring names, memory configuration etc.
Register Access
The register page allows access to registers per IP block. Alternatively, they can be searched for using the register name and field name text areas.
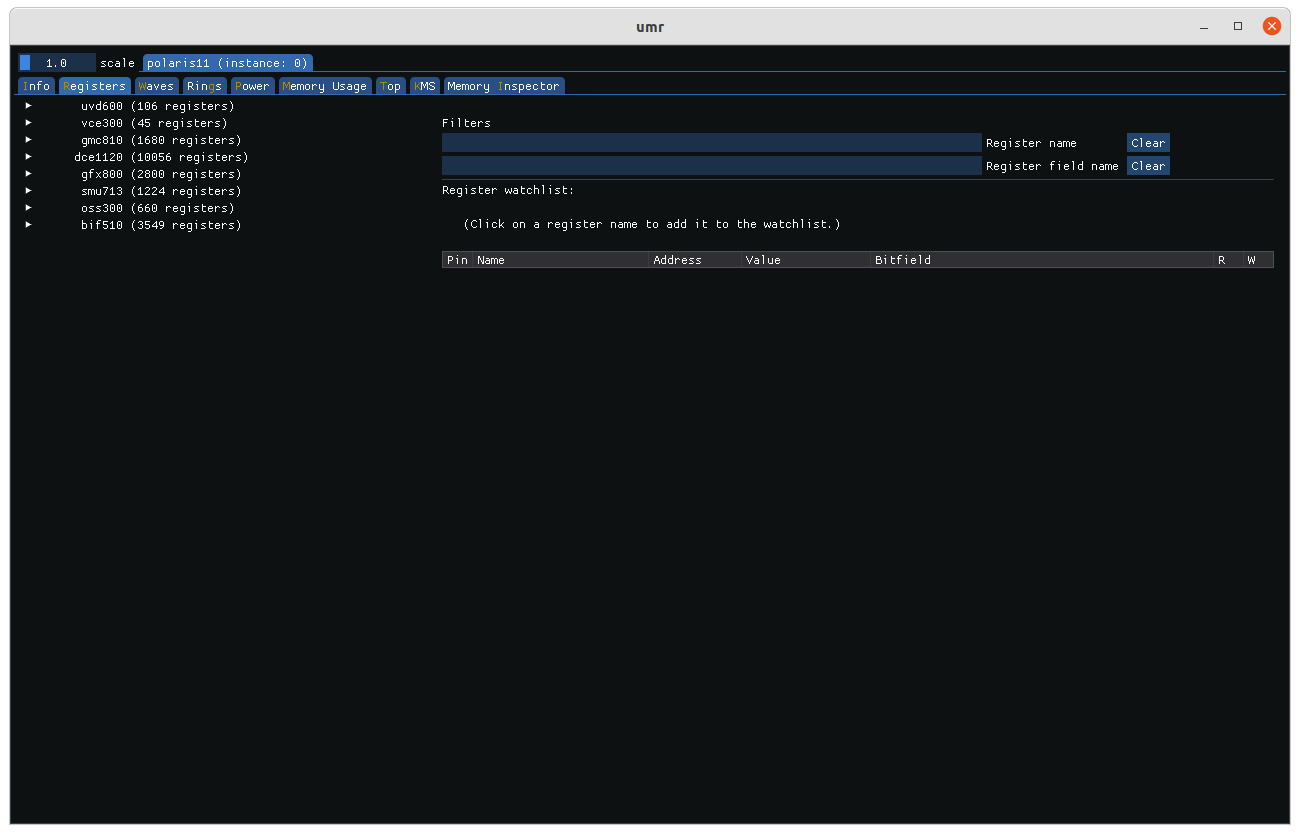
UMR lists the IP blocks available which can be clicked on to expand their list of registers available. Registers can be read by clicking on them which adds them to the view.

Registers in the view can be auto refreshed by clicking on the auto-refresh box and setting the interval.

Wave Status
Reading wave status is accomplished on the Waves tab.
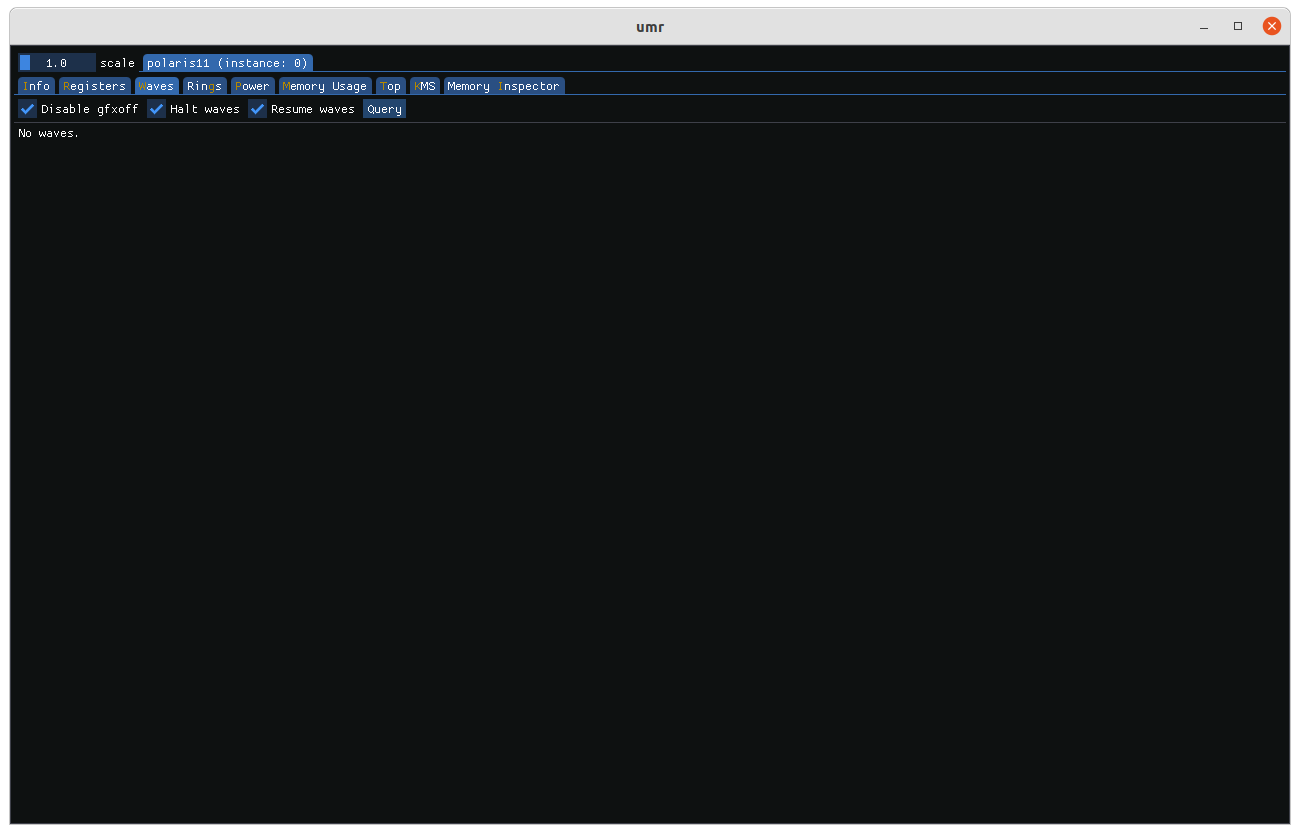
By clicking the query button active waves can be displayed. Checking ‘disable gfxoff’ will ensure that the power saving feature GFXOFF does not interrupt reading registers.
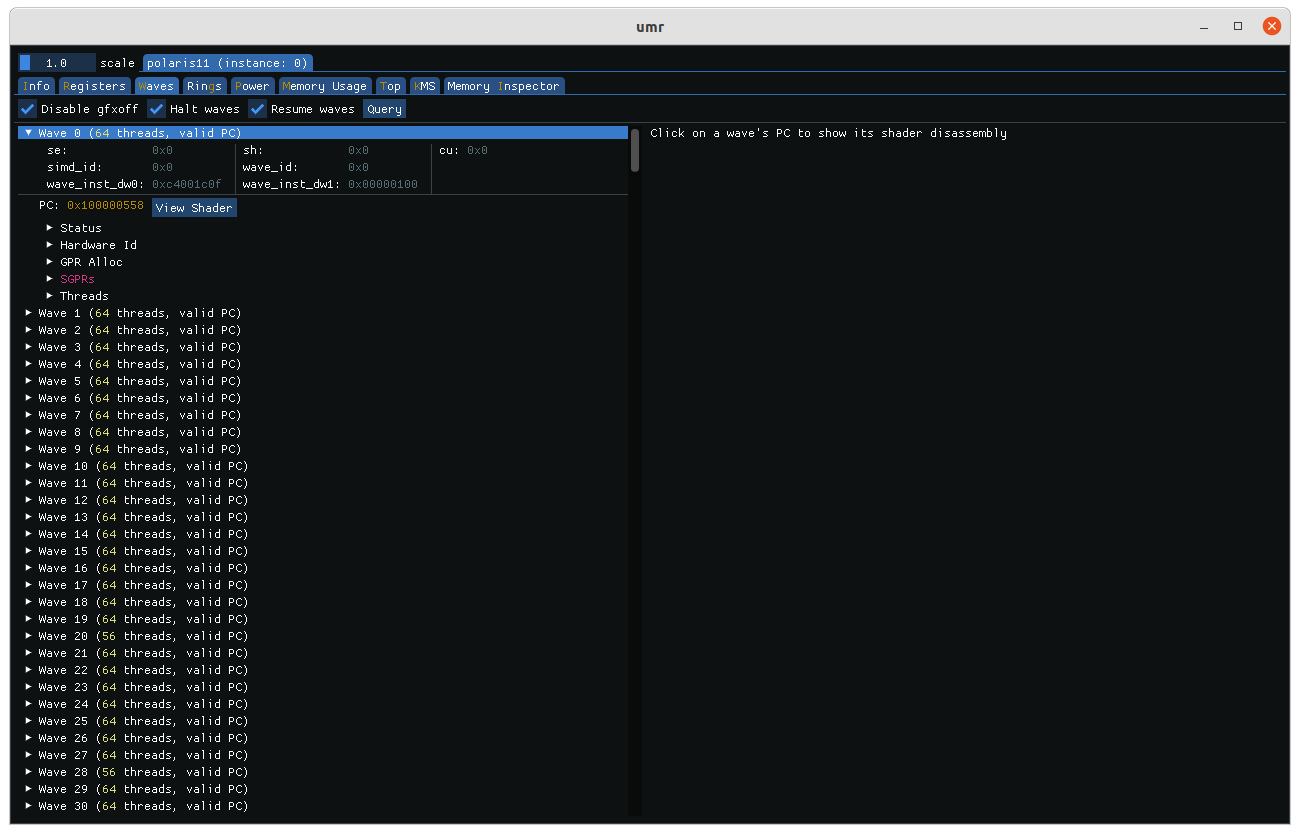
Once waves are queried they are listed by order of which waves are active. The various status registers can be displayed by expanding their fields, if a shader is found it can be display in the right half by clicking ‘view shader’.
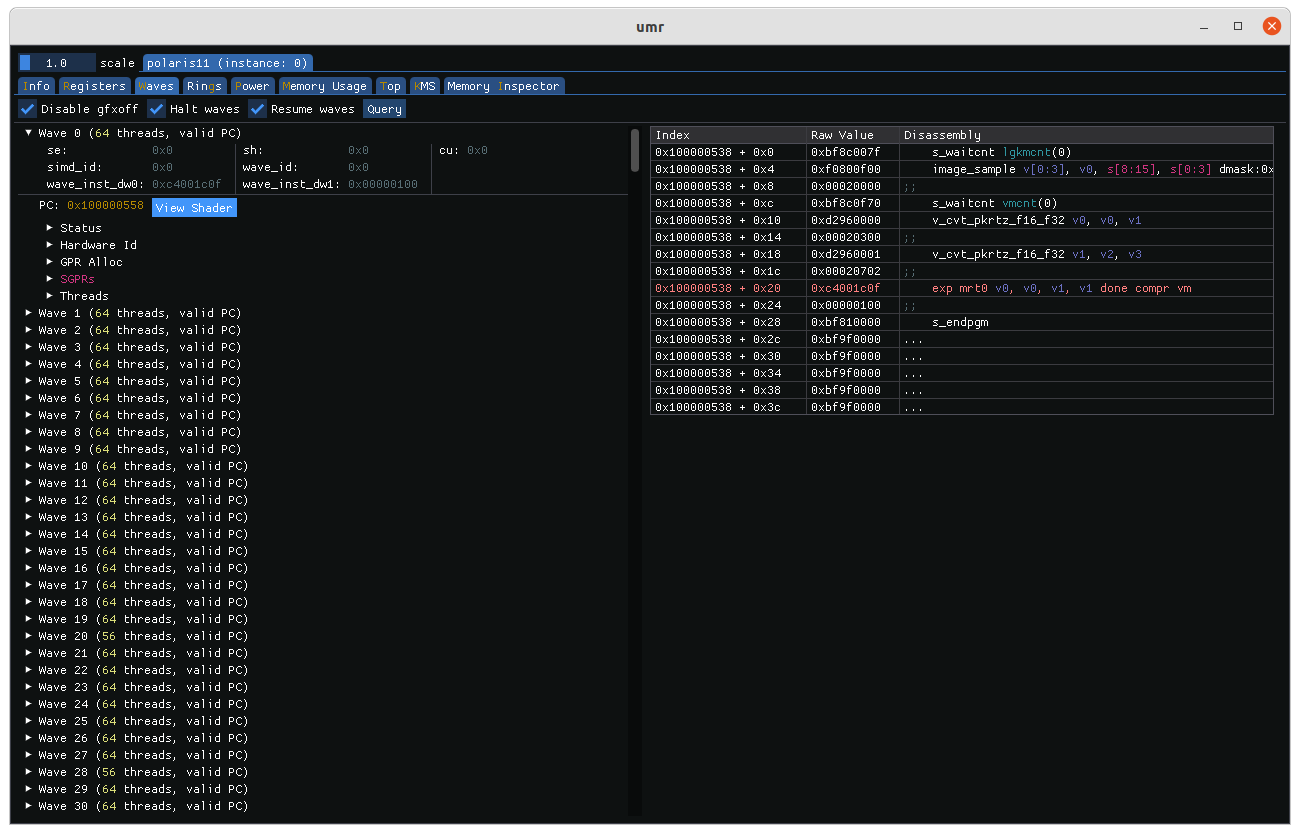
The highlighted line in the shader output represents the PC address for that particular wave at the time of the wave data was captured.
Reading Rings
Reading rings is accomplished on the Rings tab.
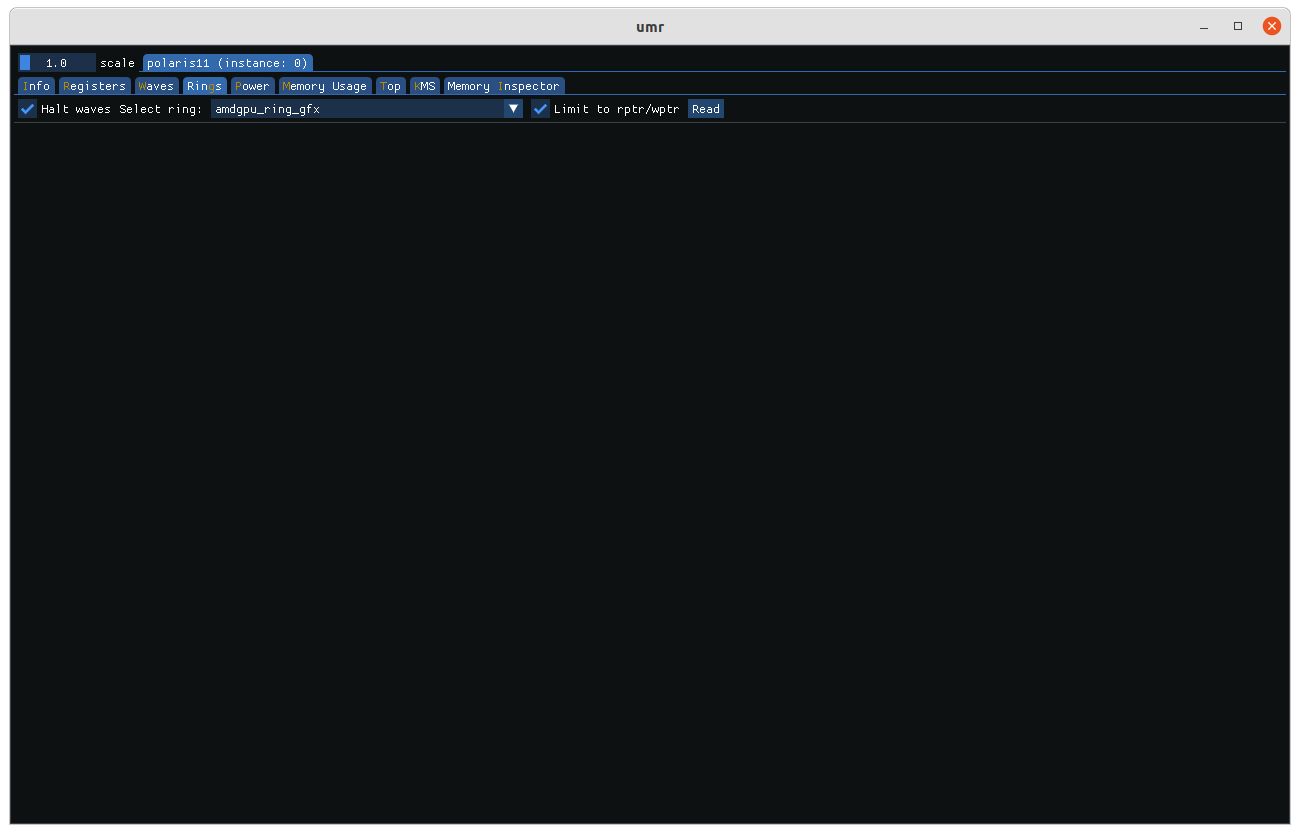
The ‘Limit to rptr/wptr’ option is checked by default since normally reading outside that range leads to undefined behaviour. You can read outside it by unchecking the box.
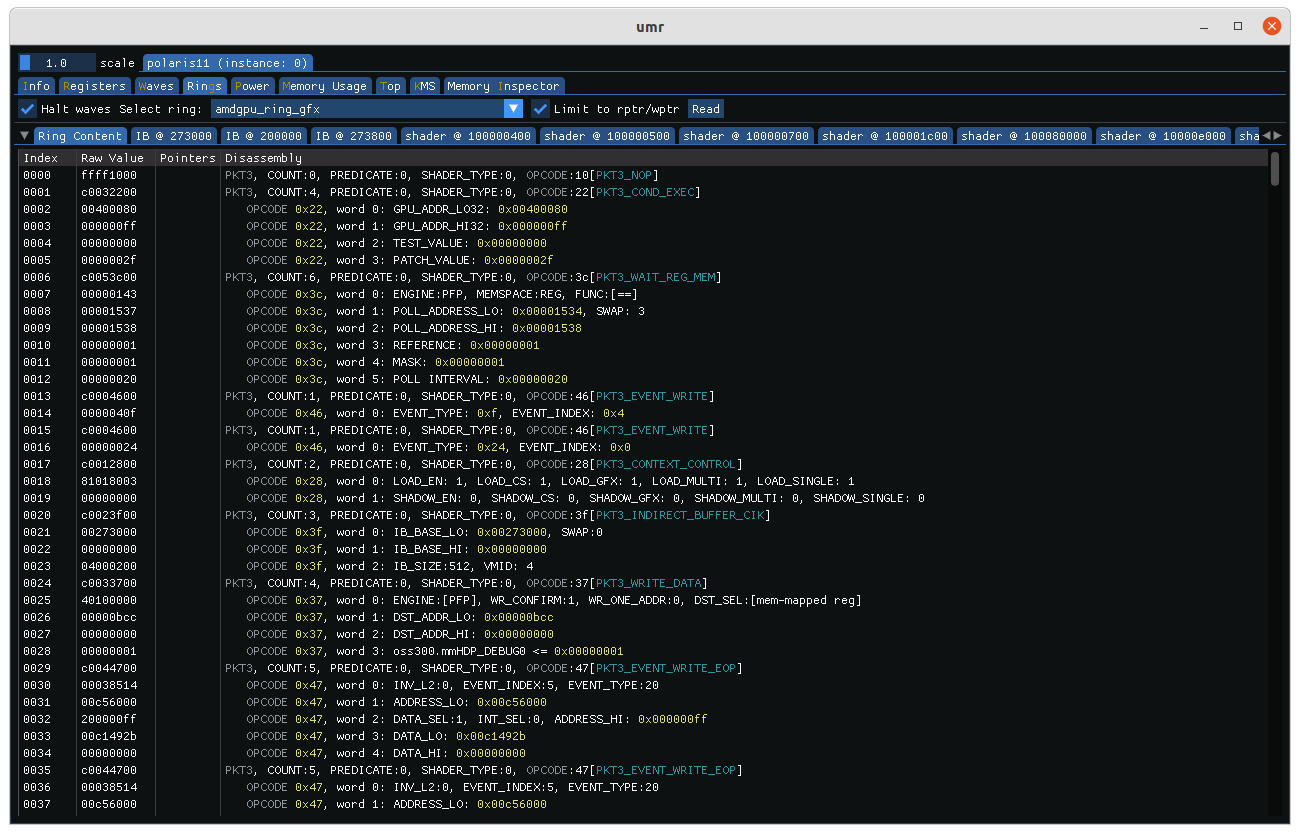
The initial reading tab shows the contents of the ring buffer itself. By default between the RPTR and WPTR. The raw values as well as the decoding of the ring are presented. Tabs are added to the right if indirect buffers (IBs) or shader programs are found.
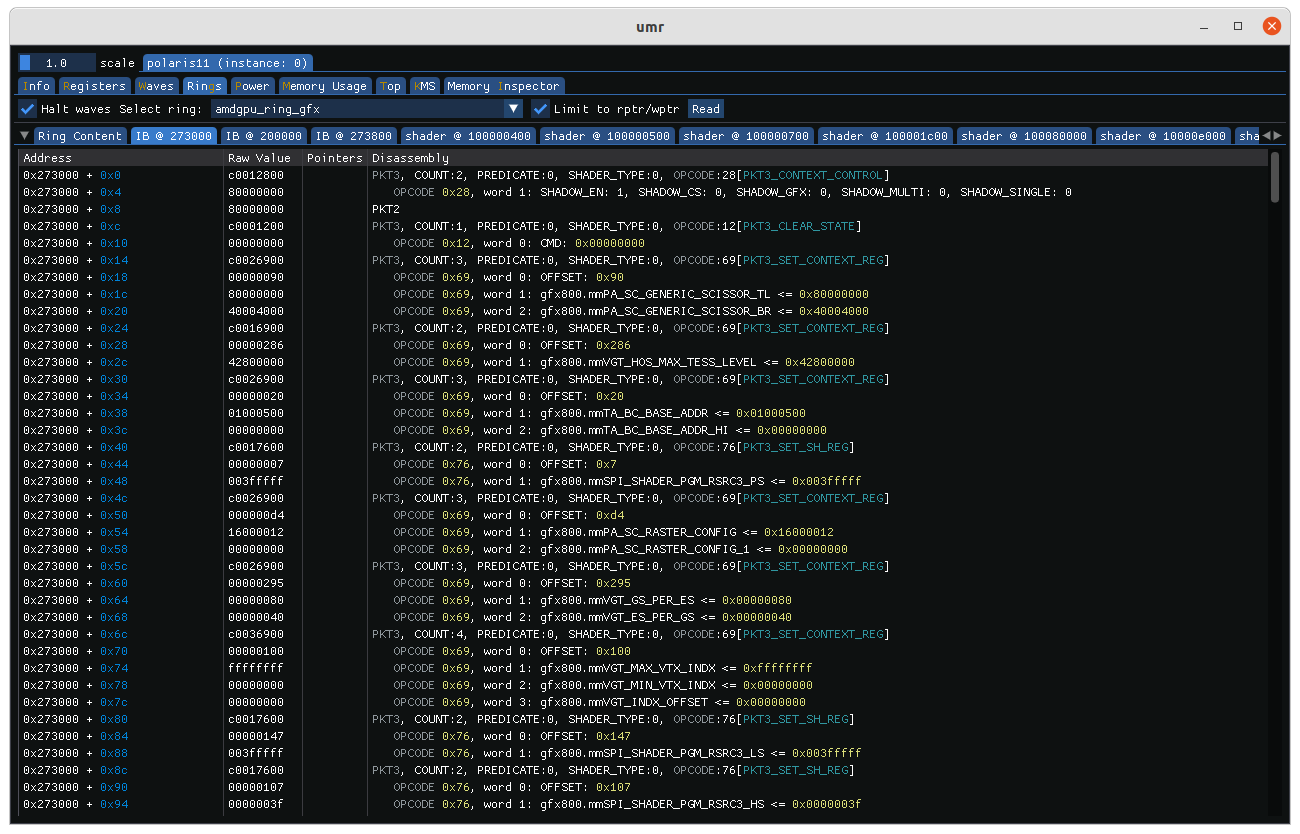
Indirect buffer objects can be decoded as well. The offset from the start of the object is presented along with the raw values in order to aid in debugging.
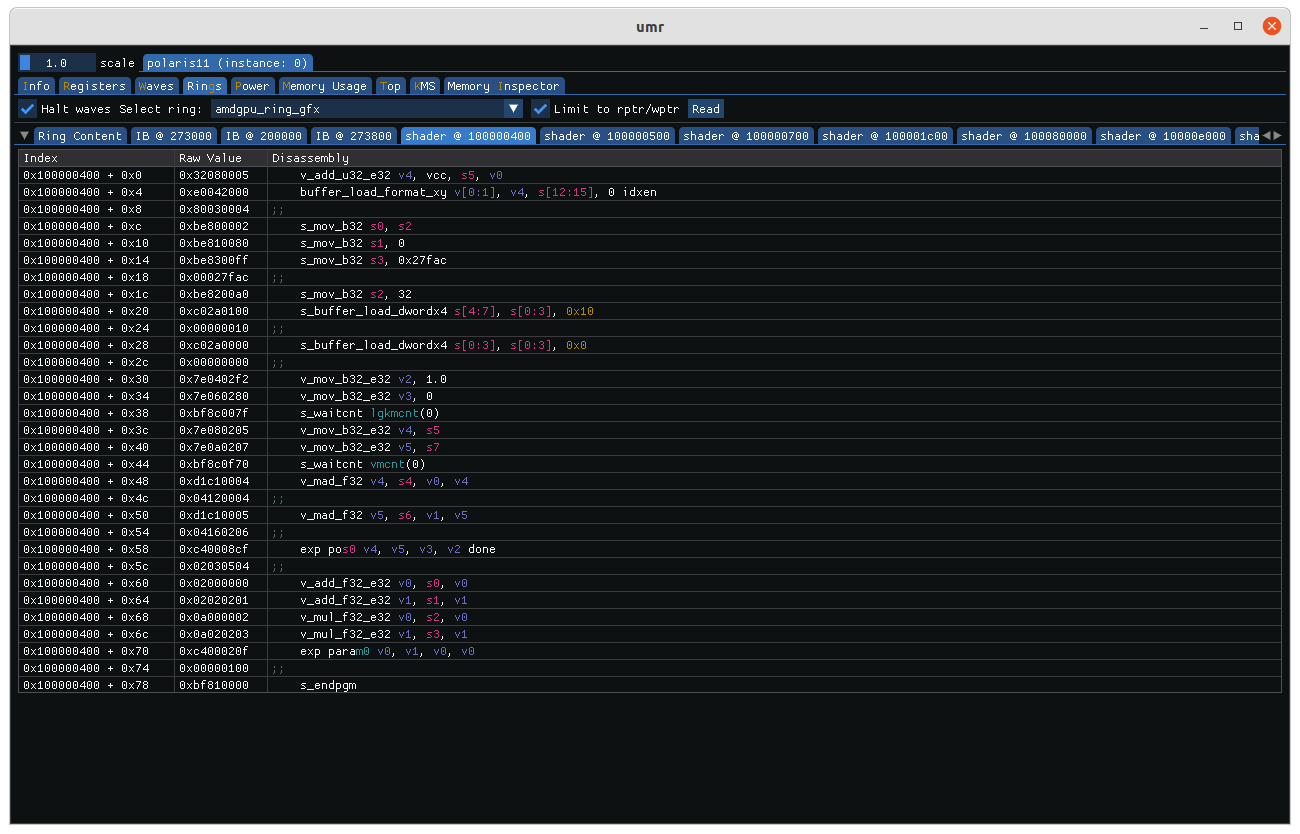
Shaders if found are presented in their own tabs named after the GPUVM address they were found at.
Power Status
The current power status of the ASIC can be viewed on the power tab. The actual types of sensors available vary per ASIC. The tab graphs the various sensors over time.
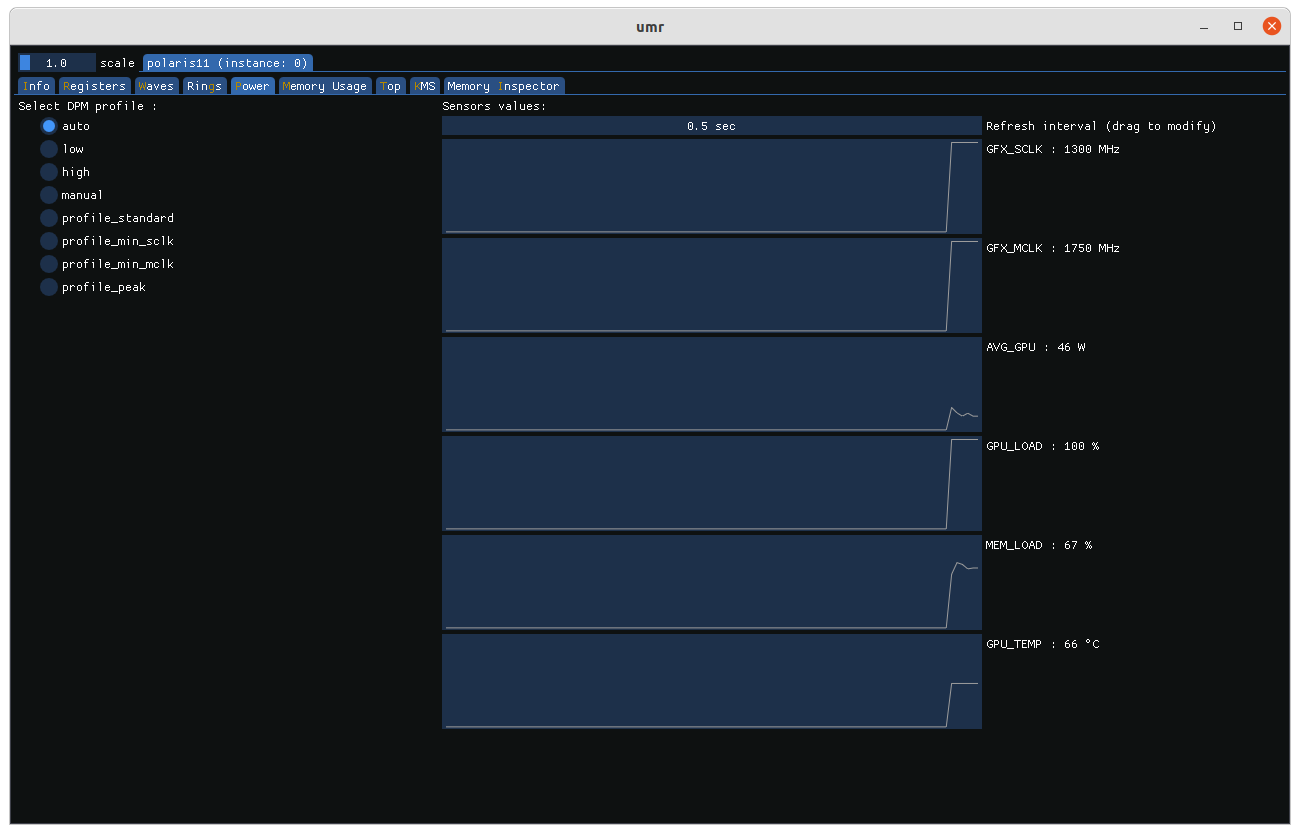
The different DPM profiles can be selected with the radio buttons on the left.
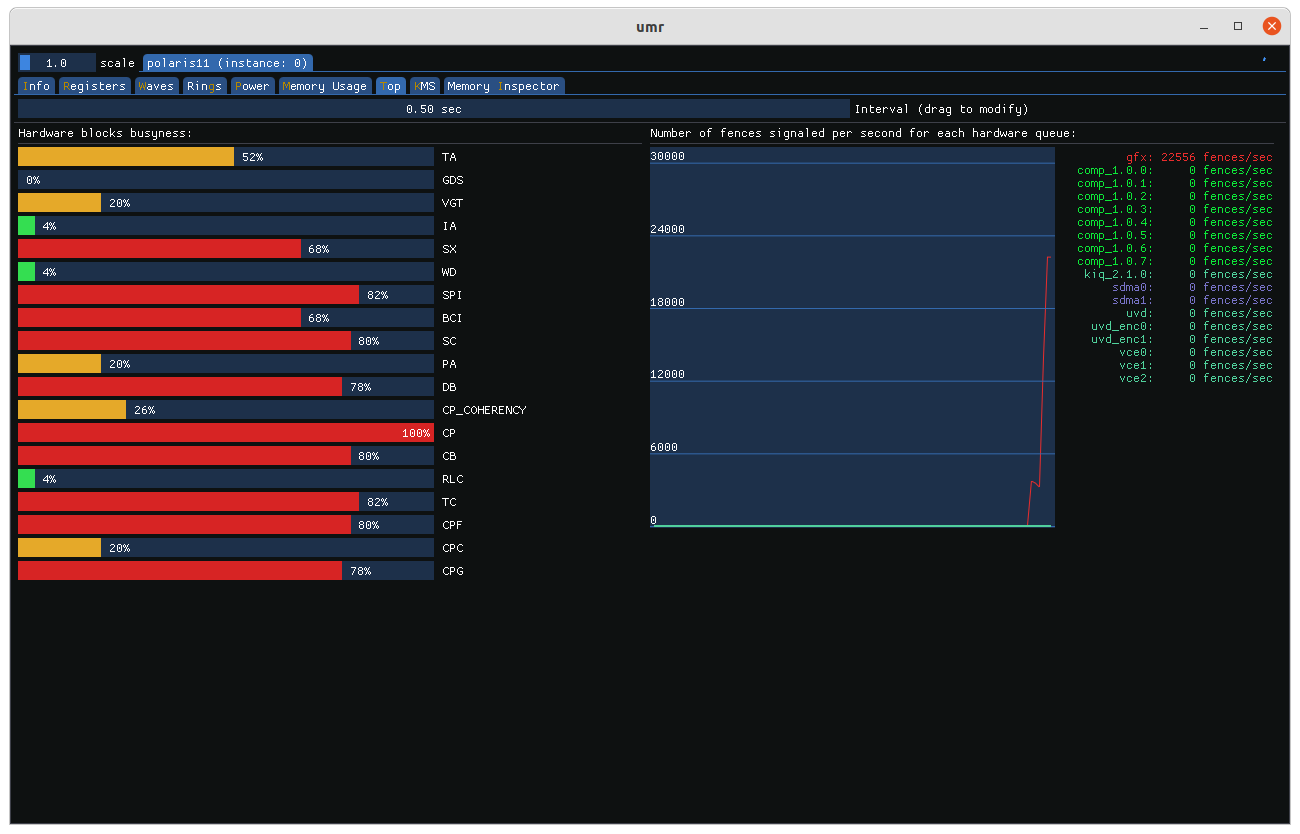
ASIC Top
Monitoring of various graphics hardware blocks is available on the tab named ‘Top’. The various blocks monitored by the GRBM_STATUS register are bar graphed on the left. Green indicates low activity, yellow moderate, and red coloured bars indicating heavily busy blocks. On the right the number of fences per second are graphed. The various types of IP blocks that emit fences are grouped together by colour.
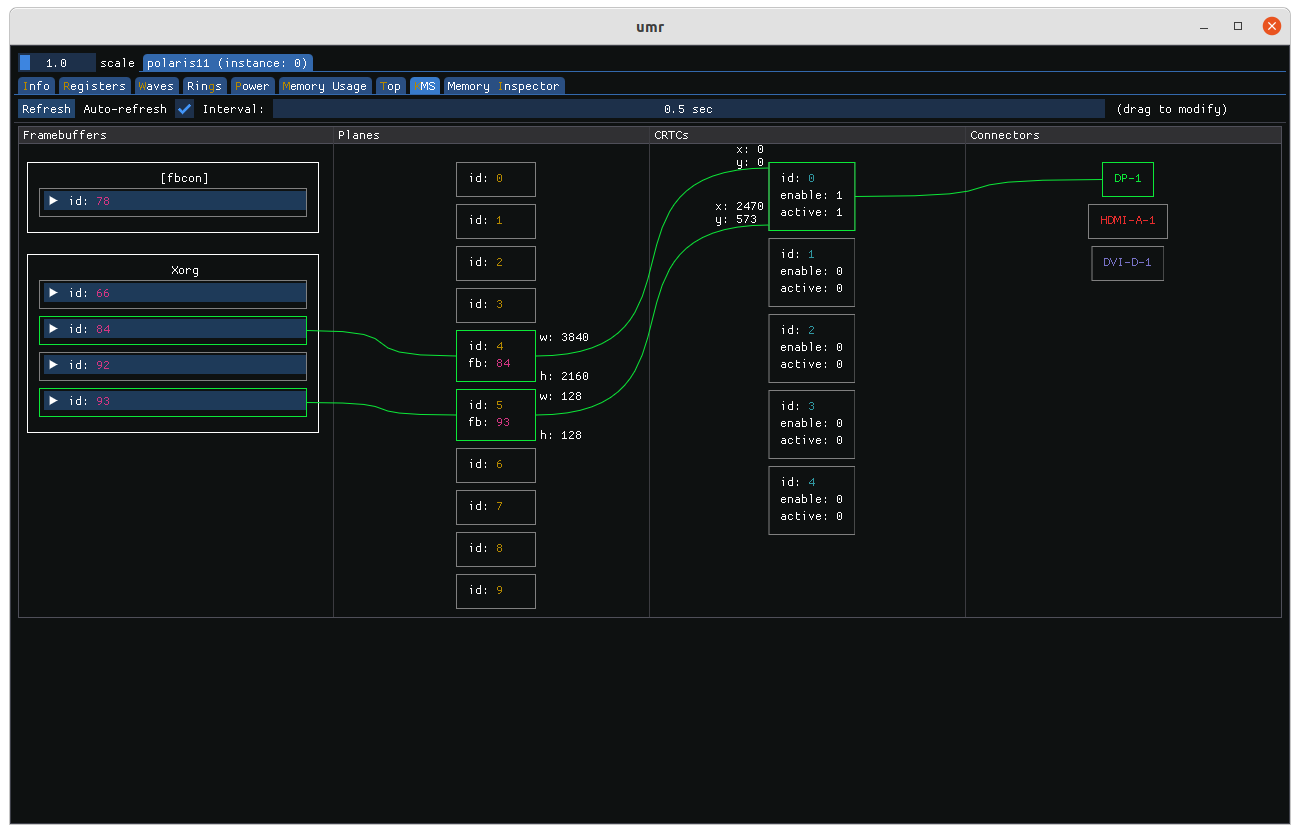
KMS Monitoring
The KMS tab visualizes how different framebuffer objects map (if at all) to display hardware and ultimately display connectors.
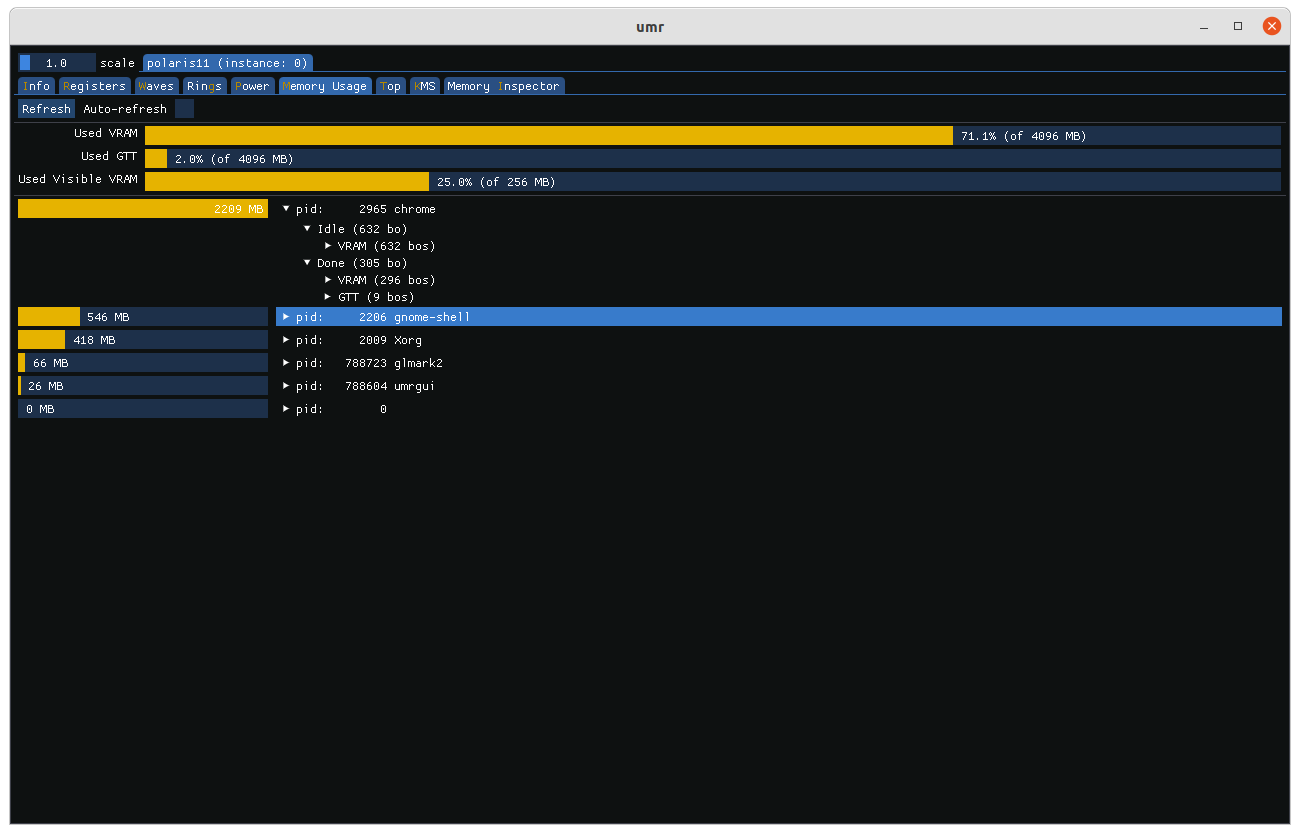
Memory Usage
GPU VRAM usage can be visualized on the ‘memory usage’ tab. The tab breaks down used VRAM, GTT, and visible VRAM.
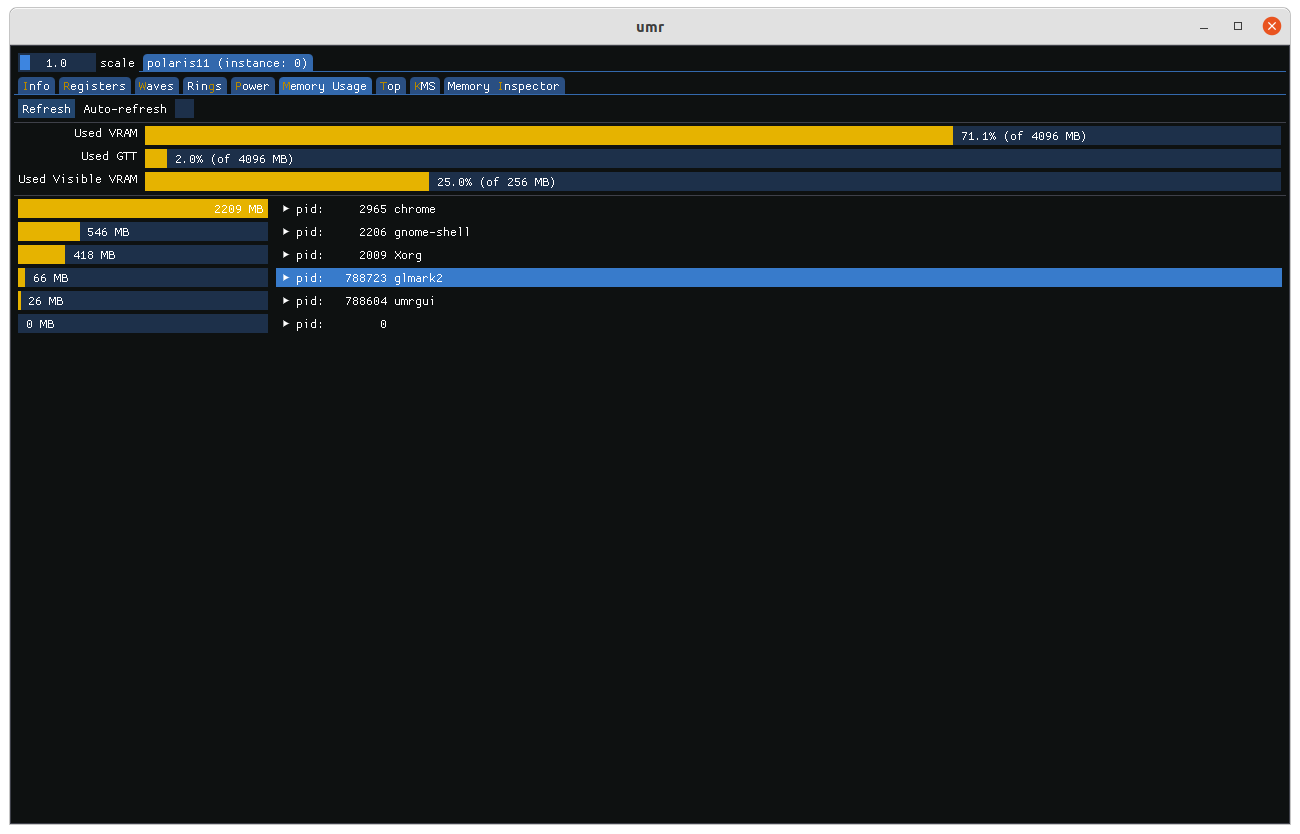
Usage of individual applications can be viewed by clicking on their pid.
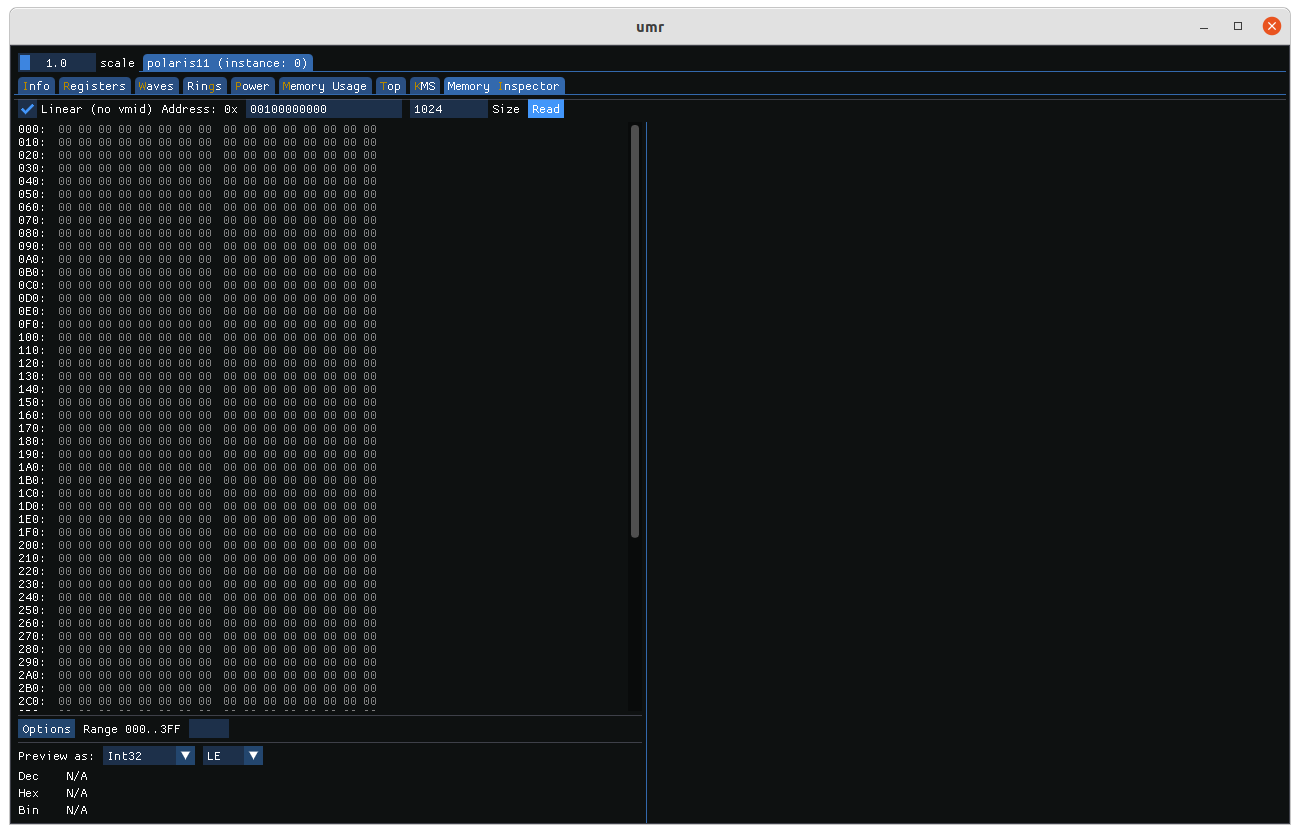
Reading GPU VM memory
GPU virtual and linear memory can be accessed on the ‘Memory Inspector’ tab. A linear (non-virtual) address can be specified by checking the linear box otherwise a VMID can be specified. Like command line umr the upper 8 bits of of the VMID can be used to specify a hub.
The address and size of the block to inspect are next with the address specified in hexadecimal and the size in decimal.